

Forest Plotter is an automated visualization platform that transforms GWAS and genetic association summary data into clear, publication-ready forest plots with minimal user intervention. Upload a structured CSV, and get an interactive visual summary of effect sizes, confidence intervals, and statistical significance — built for genomics, Mendelian randomization, and statistical genetics research.

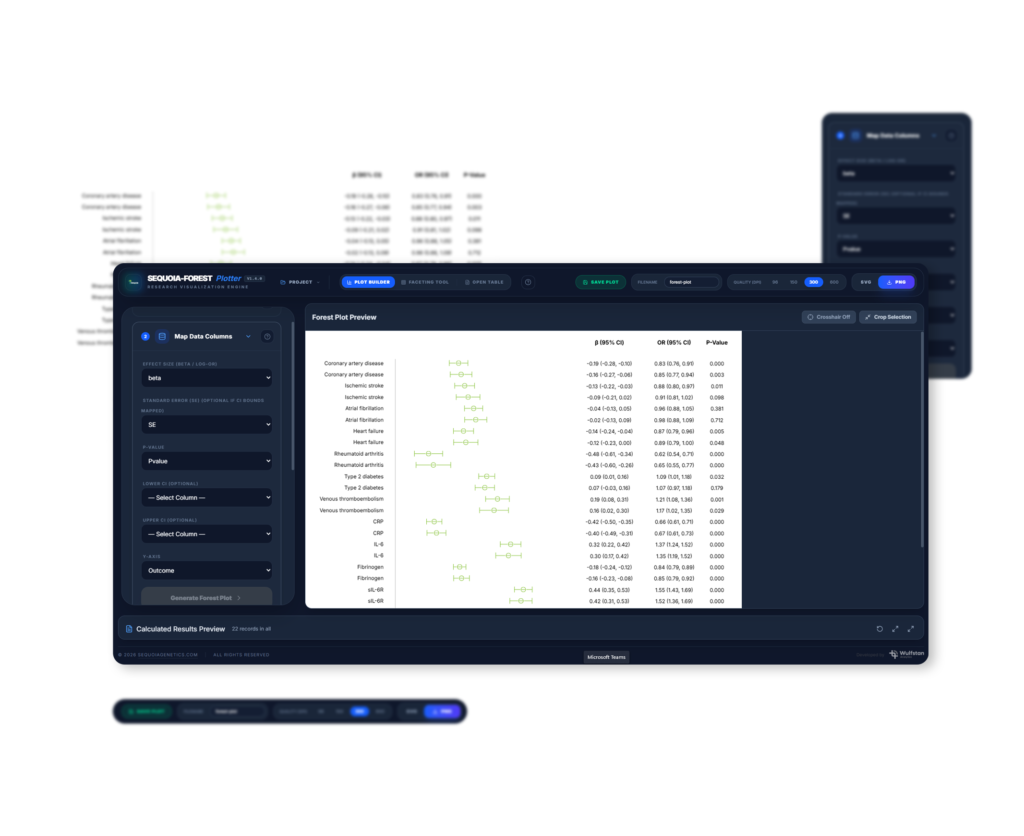
Forest Plotter combines automated statistical processing with intuitive visualization to turn complex genetic association data into clear, interpretable results. From rapid dataset processing to customizable, publication ready figures, every feature is designed to simplify analysis and support faster, more reproducible genomic research.
Turn GWAS or genetic association summary statistics into publication-ready forest plots in a few simple steps.
Upload GWAS or genetic association summary statistics in structured CSV format.
The platform automatically validates the dataset and processes effect estimates, confidence intervals, and significance values.
Study-level results are transformed into an interactive forest plot with effect sizes and confidence intervals.
Customize, filter, explore, and export high-resolution publication-ready figures.
Forest Plotter is purpose-built for genomic research and statistical genetics, combining automated analysis, intuitive visualization, and scalable performance in one streamlined platform. It reduces the complexity of preparing forest plots while delivering consistent, high-quality results that researchers can confidently use for analysis, interpretation, publications, and scientific reporting.
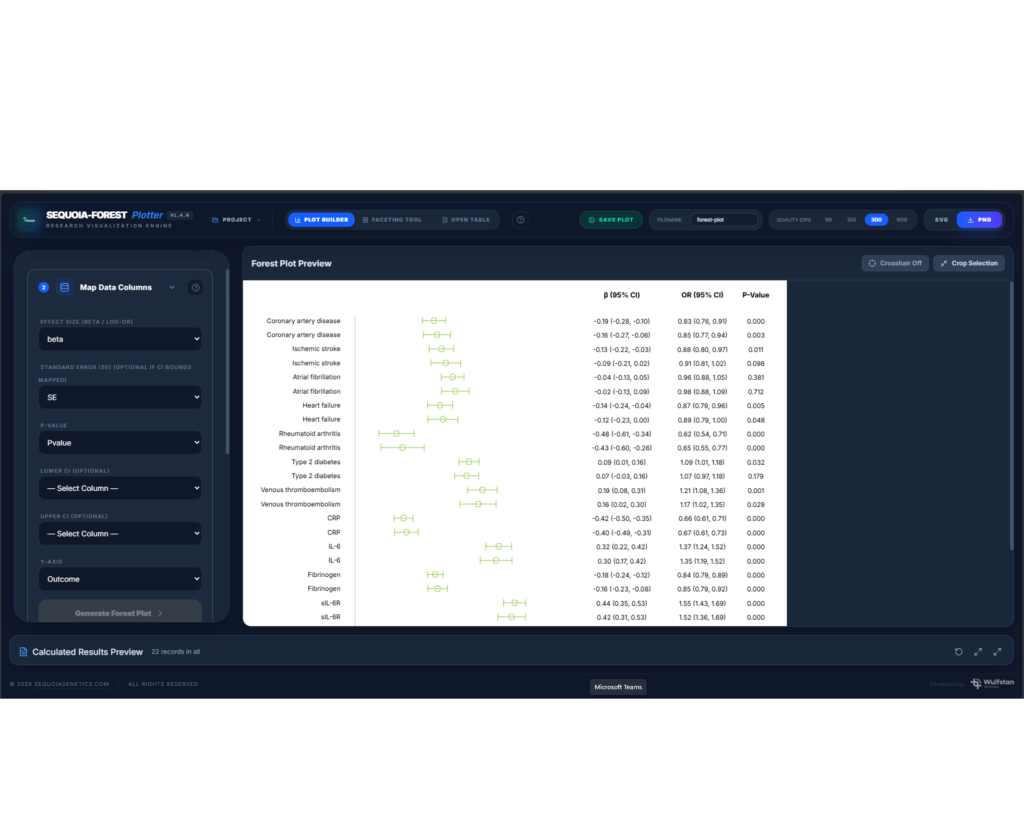
See how Forest Plotter automatically transforms GWAS and genetic association summary statistics into interactive, publication-ready forest plots.
Explore your results faster, interpret genetic associations with confidence, and generate high-quality figures with minimal manual effort.
Request a Live Demo →
Corporate Office
Level 26, East Tower, World Trade Centre, Echelon Square, Colombo 01, Sri Lanka
Delivery & Operations Center
14, Level 4, Hatch Works, Sir Baron Jayathilaka Mw, Colombo 01, Sri Lanka
Copyright © 2026 All Rights Reserved.